脑电脑网络分析代码使用流程介绍
posted on 28 Mar 2019 under category EEG
2018年5月-7月,袁老师安排我去电子科大跟随徐老师学习脑电数据挖掘,徐老师组主要用的是EEG脑网络分析方法,因此在科大的两个多月的时间里主要就是学习了如何用matlab脚本来进行脑电的脑网络。本文主要就是对之前我在徐老师组学习期间使用过的代码的一个整理,大家以后如果需要做脑网络分析的,可以根据文中描述的步骤使用这些代码(代码都放在实验室的私有云上面了,路径: /Documents/ERP and EEG/ACR脑电数据处理代码集/4.EEG脑网络分析代码)。
1.预处理
此处的预处理不是针对原始数据的预处理,而是对已经预处理完的数据而言的。代码如下:
 clear all
 close all
 clc
% path = 'C:\Users\Administrator\Desktop\ERP_yukang';
% filename = dir(path);%加载路径(文件)
 File = 'D:\61_all\'; %这里改为数据导入路径
 savepath = 'D:\61_conditions\' ;%这里改为数据导出路径
% freqband = [0.02 40];
% freqband = [0.02 5];
 max_order = 99;
 for sub = 1:61;%这里改为自己数据中被试的数量
    %     cnt = loadcnt1([path, '\', filename(sub).name]);%加载cnt数据
    %     a = pop_loadset('C:\Users\Administrator\Desktop\ERP_yukang\sub1_erp.set');
%     eval(['pop_loadset',' ',File,'sub',num2str(sub),'_erp.set']); %加载rest数据
%     eval(['pop_loadset',' ',File,'sub_0',num2str(sub),'.mat']); %加载rest数据
      if sub<= 9;
           eval(['pop_loadset',' ',File,'sub_0',num2str(sub),'.mat']); %加载rest数据
    else
      eval(['pop_loadset',' ',File,'sub_',num2str(sub),'.mat']);
    end
    struct = ans;
    Data1 = ans.data;
    %% 去导联,得到准确的数据
%     [bool,inx] = ismember ({'AF3','Fz','F1','F3','FC1','F7','FCz','FC3','Cz','C1','C3','CP3','Pz','P3','P5','P7','PO3','PO7','Oz','O1','AF4','F2','F4','F8','FC2','FC4','C2','C4','CPz','CP4','P4','P6','P8','POz','PO4','PO8','O2'},{struct.chanlocs.labels}.');%inx是位置,bool是布尔值,
    [bool,inx] = ismember ({'AF3','Fz','F1','F3','FCz','Cz','C1','C3','CP1','CP3','Pz','P3','Oz','O1','AF4','F2','F4','C2','C4','CPz','CP2','CP4','P4','POz','O2'},{struct.chanlocs.labels}.');%inx是位置,bool是布尔值,
   Data = Data1([inx],:,:);
    stimtype = [];%
    offset = [];%
    num1 = 0; num2 = 0; num3 = 0;num4 = 0;
    C_V_data = []; F_N_data = []; F_data = [];S_data = [];
    %获取标签值 free_neutral    change_suppression    free    suppresion   change_view
    for  ii = 1:length(struct.event);
        if strncmp(struct.event(ii).type,'change_view',11)
                num1 = num1 + 1;
               C_V_data(:,:,num1) =  Data(:,:,ii) ;%change_view_data
        end

        if strncmp(struct.event(ii).type,'free_neutral',12)
                num2 = num2 + 1;
               F_N_data(:,:,num2) =  Data(:,:,ii); %free_neutral_data
        end

        if strncmp(struct.event(ii).type,'free',11)
            num3 = num3+1;
            F_data(:,:,num3) =  Data(:,:,ii);
        end

        if strncmp(struct.event(ii).type,'suppresion',11)
            num4 = num4+1;
            S_data(:,:,num4) =  Data(:,:,ii);%suppresion_data
        end
    end

    if sub<= 9;
           save([savepath,'C_V_data','\','CVdata_0',num2str(sub)],'C_V_data');
           save([savepath,'F_N_data','\','FNdata_0',num2str(sub)],'F_N_data');
           save([savepath,'F_data','\','Fdata_0',num2str(sub)],'F_data');
           save([savepath,'S_data','\','Sdata_0',num2str(sub)],'S_data');
       else
           save([savepath,'C_V_data','\','CVdata_',num2str(sub)],'C_V_data');
           save([savepath,'F_N_data','\','FNdata_',num2str(sub)],'F_N_data');
           save([savepath,'F_data','\','Fdata_',num2str(sub)],'F_data');
           save([savepath,'S_data','\','Sdata_',num2str(sub)],'S_data');
    end

end
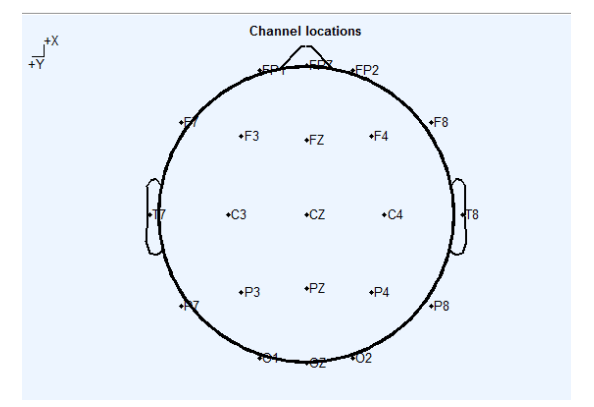
上述代码有些地方需要自己修改,除数据储存路径需要修改之外,还有几个地方需要强调:(1)在导入文件时,对被试的编号有一个判断语句,这是因为我的数据命名时,对1-9号被试采用的是01、02….09这种命名方式,因此在循环导入被试数据时,1-9的被试和10以后的被试的导入方式被分开了,如果你的数据命名方式不一样,那么此处需要改动。(2)代码中有一个 ismenber 的函数,这个函数是用来判断当前进入循环的被试是否包含大括号中的所有电极点,返回值中有一个bool值,如果该被试缺少括号中的电极,那么bool值就为0,否则为1,当bool值中出现了0,程序就会报错并中断,这个时候我就可以根据bool值反馈的信息对大括号中的电极点进行删改,直到所有的被试都能跑通,有时候需要对电极点和被试的数量做折中处理,当然如果一些非常重要的电极点缺失的话那就需要补电极了,关于补电极点会在后面的内容中提到。此外,在脑网络分析中有21个常见的电极点需要纳入分析(这21个电极点见下图)。(3)后面的标签循环中的Mark需要改为自己的Mark,在我的实验中一共有四种Mark(change_view,free_neutral,free,suppression),因此我们用了四个判断语句。(4)最后,在保存文件中需要在前面的保存路径中新建几个文件夹(根据你Mark的种类,有几种Mark就建立几个文件夹)。
常见的21个电极点:

2.计算PLV
将条件分完组后,就开始针对每种条件计算plv了。代码如下(代码名称plv.m):
%%  **********************************************   %%
%% 作者:LYY
%% 功能:基于plv,计算几类数据的网络属性,
close all;
clear all;
clc;

File = 'E:\yukang\68_condition\F_N_data\androgynous_male\';
File1 = dir(File);
% Emo = {'C_V','F_N','F','S'};
% for e = 1:4
%     File2 = dir(['C:\Users\uestc\Desktop\西南同学\raw_data\']) ;
    S = length(File1) -2 ;
%     Emo1 = {'CV','FN','F','S'};
    for Sub = 1:S
        if Sub <=9;
%             eval(['load',' ',File ,num2str(Emo{e}) ,'_data','\',num2str(Emo1{e}),'data_0',num2str(Sub),'.mat']);
            eval(['load',' ',File ,'FNdata_0',num2str(Sub),'.mat']);
        else
            eval(['load',' ',File ,'FNdata_',num2str(Sub),'.mat']);
        end
        %%
        Data = F_N_data(:,325:574,:);
        %% 幅值计算,只计算中央顶区三通道(CP1(12),CPz(26),CP2(27))的幅值
%         Data1 = mean(Data,3);%trail数平均
%         data =mean(Data1([9,20:21],:),1);%平均3个导联
%         ampLpp(Sub) = mean(data);%计算出所有被试在200-1700ms间的平均(最大)幅值
%         save(['D:\61_plv_amp\amp_data\FN_amp.mat'],'ampLpp');
        Fs =250;
        AAA = [];
        for k= 1:size(Data,3)%trail的个数
            AAA = Data(:,:,k);%,
            CorrMatrix(:,:,k) = Connect_PLV(AAA);%计算plv
        end
        plvMatrix1 = mean(CorrMatrix,3);
        plvMatrix(:,:,Sub) = plvMatrix1;

        save(['E:\yukang\68_plv_data\FN_plv2\androgynous_male\FN_plv.mat'],'plvMatrix');
    end
% end
注意:(1)这个代码是需要对每个条件分开跑,代码计算的结果包括幅值和plv,这里之所以计算幅值,是因为后面我计算了幅值和网络属性的相关。(2)在用这个代码之前,需要在你的路径中添加 Connect_PLV PhaseSI data_psi三个函数
3. 画网络拓扑图
接下来,就开始画网络拓扑图了,使用的代码是 plot_network.m 。
%% Ttest2画出网络拓扑图
clear all
% close all
clc
% file = 'F:\p300\taskState_result\a_task_data\c_plvData\HC_Data\';
% file = 'F:\p300\result\rest_data\coh\cohNomal\';
% Sub_File = dir([file,'*.mat']);
% nomal_data = [];
% for Sub = 1:length(Sub_File)
%     load([file,Sub_File(Sub).name]);
% %   eval(['load',' ',File,'Re_Coh0_',num2str(Sub),'.mat']);
%     nomal_data(:,:,Sub) = plvMatrix1;
% %     nomal_data(:,:,Sub) =Re_Coh0 ;
% end
% nomal_data(:,:,[5,14]) = [];
% % nomal_data(:,:,[4,5,7,14,15,19]) = [];
% file = 'F:\p300\taskState_result\a_task_data\c_plvData\SZ_Data\';
% % file = 'F:\p300\result\rest_data\coh\cohSch\';
% Sub_File = dir([file,'*.mat']);
% sch_data = [];
% for Sub = 1:length(Sub_File)%length(Sub_File)
%     load([file,Sub_File(Sub).name]);
% %   eval(['load',' ',File,'Re_Coh0_',num2str(Sub),'.mat']);
%     sch_data(:,:,Sub) = plvMatrix1;
% %     sch_data(:,:,Sub) = Re_Coh0;
% end
% sch_data(:,:,[6,8,12,16])=[];
% % sch_data(:,:,16)=[];
% % mkdir('F:\p300\result\sch\sch_data');
% % save('F:\p300\result\sch\sch_data_1','sch_data');

load E:\yukang\68_plv_data\F_plv2\androgynous_female\F_plv.mat
FN_data = plvMatrix;

load E:\yukang\68_plv_data\F_plv2\androgynous_male\F_plv.mat
F_data = plvMatrix;

[m,n] = size(F_data(:,:,1));%得到导联数据
H=[];
P=[];
for i = 1:m
    for j = 1:n
        %[h,p,ci,stats] =ttest2(nomal_data(i,j,:),sch_data(i,j,:),0.05,'left');
         [H_right(i,j),P_right(i,j)] = ttest2(FN_data(i,j,:),F_data(i,j,:),0.001,'right');
         [H_left(i,j),P_left(i,j)] = ttest2(FN_data(i,j,:),F_data(i,j,:),0.001,'left');%正常人值大于病人的值
    end
end

H_left= -H_left;%left为红(根据H值来画的)
H=squeeze(H_left+H_right);%矩阵相加

% SaveFile = 'F:\p300\taskState_result\a_task_data\c_plvData\plot\';
% mkdir(SaveFile);
    %%%%%%%%%%%%%%%画出有效连接%%%%%%%%%%%%%%%%%%%%%%%%%%%%
    k1 = length(H(:,:));
    f_name1 = '';   %标题
%     channel ={'AF3','Fz','F1','F3','F7','FCz','Cz','C1','C3','CP1','CP3','Pz','P3','P7','Oz','O1','AF4','F2','F4','F8','C2','C4','CPz','CP2','CP4','P4','P8','POz','O2'};
     channel ={'AF3','Fz','F1','F3','FCz','Cz','C1','C3','CP1','CP3','Pz','P3','Oz','O1','AF4','F2','F4','C2','C4','CPz','CP2','CP4','P4','POz','O2'};
    [x,y,loc]=textread('eeg_loc.txt','%*d %f %f %s',-1);
    a = 0;
    for i = 1:length(channel)
        for j = 1:length(loc)
            if strcmp(channel{i},loc{j})
                a = a+1;
                num(a) = j;
            end
        end
    end
    x1 = x(num);
    y1 = y(num);
    Brain_Graphic(H(:,:),k1,f_name1,channel,x1',-y1');
    title(f_name1,'fontsize',12,'fontweight','bold');
    fig_name = ['testTask'];
%     saveas(1,[SaveFile, fig_name,'.jpg']);
%     saveas(gcf,'F:\p300\taskState_result\a_task_data\c_plvData\plot\testTask.eps');
%     close figure 1;
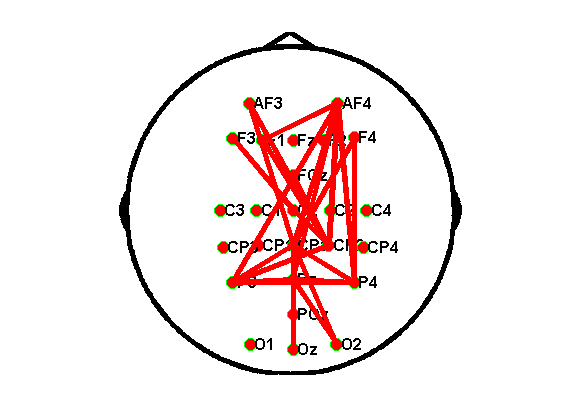
注意:(1)在跑该代码之前,你需要在matlab的路径中添加Brain_Graphic.m这个函数;(2)另外,在该代码的文件夹下面需要放一个txt文档,里面是你用到的电极的坐标信息(电极的坐标信息可以通过eeglab导出);(3)该代码的导入数据为上一步算完的plv数据,导入的时候,仍旧是按照不同的条件分组导入;(4)channel后面的电极点和预处理代码中的电极保持一致;(5)这一步中可能出现很多问题,画出的拓扑图很可能是奇形怪状,主要改的地方是Brain_Graphic.m函数以及txt文档中的内容。
画出来的正常拓扑图应该是这样的:

4.计算网络属性图
网络属性是对网络拓扑图的描述,常用的网络属性包括四种:聚类系数(Clustering Coefficient)、路径长度(Path length)、全局效率(Global efficiency)和局部效率(Local efficiency)。其中,聚类系数描述了一个网络中节点的聚类程度,也反映了在特定情况下一个网络的集群特性;路径长度描述的是网络中连通性的高低,路径长度越短,两个节点之间的信息传递效率就越高,网络的连通性也就越好,反之就越差;全局效率代表了大脑的网络整体的信息传输能力;局部效率描述的是节点所蕴含的信息在网络的局部中传输的能力,网络的局部效率越高,信息在它的局部网络中的传递效率就越高,网络的分化程度就越低。聚类系数和局部效率这两个属性表达了脑区之间的功能性连接效应,反应了脑网络处理局部信息的能力;全局效率和路径长度这两个网络属性这体现了脑网络处理全局信息的能力。
废话少说,上代码(代码名称 network_properties.m):
%% 计算网络属性
clear all
% close all
clc

SaveFile = 'F:\kangkang_data\properties\';
mkdir(SaveFile);
file = 'F:\kangkang_data\cohdata\S_cohdata\Re_Coh0\f_a\';%计算plv属性
Sub_File = dir([file,'*.mat']);
for Sub = 1:length(Sub_File)%循环被试
    load([file,Sub_File(Sub).name]);
    %     eval(['load',' ',file,'Re_Coh0_',num2str(Sub),'.mat']);
    [m,n]=size(Re_Coh0);
    CorrMatrix1_1 = Re_Coh0;
    CorrMatrix1_1 = Re_Coh0-eye(m,n); %去掉主对角线上的值
    %     Re_Coh0_1 = Re_Coh0; %不把主对角线置零,cluster和E_loc值有差别
    %聚类系数
    Cluster_1 = mean(clustering_coef_wu(CorrMatrix1_1));
    %路径长度
    Matrix11 = ones(size(CorrMatrix1_1))-CorrMatrix1_1;
    Matrix11(1:n+1:end) = 0;
    [D11 B11] = distance_wei(Matrix11);
    CharpNet_1 = sum(sum(D11))/(m*(m-1));
    %全局效率
    E_glo_1 = efficiency_wei(CorrMatrix1_1);
    %局部效率
    E_loc_1 = mean(efficiency_wei(CorrMatrix1_1,1));
%     %度
%     degree = degrees_und(CorrMatrix1_1);
    properties_1(Sub,:)=[Cluster_1 CharpNet_1 E_glo_1 E_loc_1];
    disp(['将要计算第',num2str(Sub),'个被试','_第',num2str(1),'种刺激!!!!'])
end
%  properties_1([4,5,7,14,15,19],:) = [];
% properties_1([5,14],:) = [];
save([SaveFile,'properties_S_FA','.mat'],'properties_1');


% %%
% file = 'F:\kangkang_data\cohdata\F_cohdata\Re_Coh0\';
% Sub_File = dir([file,'*.mat']);
% sch_data=[];
% %%
% for Sub = 1:length(Sub_File)%循环被试
%     load([file,Sub_File(Sub).name]);
%     %for i = 1:5
% %     eval(['load',' ',file,'Re_Coh0_',num2str(Sub),'.mat']);
%     [m,n]=size(Re_Coh0);
%     CorrMatrix1_1 = Re_Coh0;
% %     CorrMatrix1_1 = plvMatrix1-eye(m,n);       %去掉主对角线上的值
%     %聚类系数
%     Cluster_2 = mean(clustering_coef_wu(CorrMatrix1_1));
%     %路径长度
%     Matrix11 = ones(size(CorrMatrix1_1))-CorrMatrix1_1;
%     Matrix11(1:n+1:end) = 0;
%     [D11 B11] = distance_wei(Matrix11);
%     CharpNet_2 = sum(sum(D11))/(m*(m-1));
%     %全局效率
%     E_glo_2 = efficiency_wei(CorrMatrix1_1);
%     %局部效率
%     E_loc_2 = mean(efficiency_wei(CorrMatrix1_1,1));
%     properties_2(Sub,:)=[Cluster_2 CharpNet_2 E_glo_2 E_loc_2];
%     disp(['将要计算第',num2str(Sub),'个被试','_第',num2str(2),'种刺激!!!!'])
% end
% %  properties_2([6,8,12,16],:) = [];%去被试
%
% %%
% file = 'F:\kangkang_data\cohdata\F_N_cohdata\Re_Coh0\';
% Sub_File = dir([file,'*.mat']);
% sch_data=[];
% %%
% for Sub = 1:length(Sub_File)%循环被试
%     load([file,Sub_File(Sub).name]);
%     %for i = 1:5
% %     eval(['load',' ',file,'Re_Coh0_',num2str(Sub),'.mat']);
%     [m,n]=size(Re_Coh0);
%     CorrMatrix1_1 = Re_Coh0;
% %     CorrMatrix1_1 = plvMatrix1-eye(m,n);       %去掉主对角线上的值
%     %聚类系数
%     Cluster_3 = mean(clustering_coef_wu(CorrMatrix1_1));
%     %路径长度
%     Matrix11 = ones(size(CorrMatrix1_1))-CorrMatrix1_1;
%     Matrix11(1:n+1:end) = 0;
%     [D11 B11] = distance_wei(Matrix11);
%     CharpNet_3 = sum(sum(D11))/(m*(m-1));
%     %全局效率
%     E_glo_3 = efficiency_wei(CorrMatrix1_1);
%     %局部效率
%     E_loc_3 = mean(efficiency_wei(CorrMatrix1_1,1));
%     properties_3(Sub,:)=[Cluster_3 CharpNet_3 E_glo_3 E_loc_3];
%     disp(['将要计算第',num2str(Sub),'个被试','_第',num2str(3),'种刺激!!!!'])
% end
%
% %%
% file = 'F:\kangkang_data\cohdata\S_cohdata\Re_Coh0\';
% Sub_File = dir([file,'*.mat']);
% sch_data=[];
% %%
% for Sub = 1:length(Sub_File)%循环被试
%     load([file,Sub_File(Sub).name]);
%     %for i = 1:5
% %     eval(['load',' ',file,'Re_Coh0_',num2str(Sub),'.mat']);
%     [m,n]=size(Re_Coh0);
%     CorrMatrix1_1 = Re_Coh0;
% %     CorrMatrix1_1 = plvMatrix1-eye(m,n);       %去掉主对角线上的值
%     %聚类系数
%     Cluster_4 = mean(clustering_coef_wu(CorrMatrix1_1));
%     %路径长度
%     Matrix11 = ones(size(CorrMatrix1_1))-CorrMatrix1_1;
%     Matrix11(1:n+1:end) = 0;
%     [D11 B11] = distance_wei(Matrix11);
%     CharpNet_4 = sum(sum(D11))/(m*(m-1));
%     %全局效率
%     E_glo_4 = efficiency_wei(CorrMatrix1_1);
%     %局部效率
%     E_loc_4 = mean(efficiency_wei(CorrMatrix1_1,1));
%     properties_4(Sub,:)=[Cluster_4 CharpNet_4 E_glo_4 E_loc_4];
%     disp(['将要计算第',num2str(Sub),'个被试','_第',num2str(4),'种刺激!!!!'])
% end
% Properties = [properties_1;properties_2;properties_3;properties_4];
% Data=Properties';

%% 中性与负性情绪网络属性比较
% FN ={'_FN_andro_female','_FN_andro_male','_FN_non_andro_female','_FN_non_andro_male'};
% F={'_F_andro_female','_F_andro_male','_F_non_andro_female','_F_non_andro_male'};
% SaveFile = 'D:\56_properties\';
% File = dir(SaveFile);
% l1 = [];l2= [];
% for k =1:4
%     eval(['load',' ',SaveFile,'\properties',num2str(FN{k}),'.mat']);
%     l1{k} = length(properties_1);fn1{k} = properties_1;
%     eval(['load',' ',SaveFile,'\properties',num2str(F{k}),'.mat']);
%     l2{k} = length(properties_1);f1{k} = properties_1;
% end
% properties_ff(1:l1{1,1},:) = fn1{1};
% properties_ff(l1{1,1}+1:l1{1,1}+l1{1,2},:) = fn1{2};
% properties_ff(l1{1,1}+l1{1,2}+1:l1{1,1}+l1{1,2}+l1{1,3},:) = fn1{3};
% properties_ff(l1{1,1}+l1{1,2}+l1{1,3}+1:l1{1,1}+l1{1,2}+l1{1,3}+l1{1,4},:)= fn1{4};
% % properties_ff(l1{1,1}+l1{1,2}+l1{1,3}+l1{1,4}+1:l1{1,1}+l1{1,2}+l1{1,3}+l1{1,4}+l1{1,5},:) = fn1{5};
% % properties_ff(l1{1,1}+l1{1,2}+l1{1,3}+l1{1,4}+l1{1,5}+1:l1{1,1}+l1{1,2}+l1{1,3}+l1{1,4}+l1{1,5}+l1{1,6},:) = fn1{6};
%
% properties_fm(1:l2{1,1},:) = f1{1};
% properties_fm(l2{1,1}+1:l2{1,1}+l2{1,2},:) = f1{2};
% properties_fm(l2{1,1}+l2{1,2}+1:l2{1,1}+l2{1,2}+l2{1,3},:) = f1{3};
% properties_fm(l2{1,1}+l2{1,2}+l2{1,3}+1:l2{1,1}+l2{1,2}+l2{1,3}+l2{1,4},:)= f1{4};
% % properties_fm(l2{1,1}+l2{1,2}+l2{1,3}+l2{1,4}+1:l2{1,1}+l2{1,2}+l2{1,3}+l2{1,4}+l2{1,5},:) = f1{5};
% % properties_fm(l2{1,1}+l2{1,2}+l2{1,3}+l2{1,4}+l2{1,5}+1:l2{1,1}+l2{1,2}+l2{1,3}+l2{1,4}+l2{1,5}+l2{1,6},:) = f1{6};
%
% [h1,p1,ci_1,stats_1]=ttest(properties_ff(:,1),properties_fm(:,1),0.05,'left');%
% [h2,p2,ci_2,stats_2]=ttest(properties_ff(:,2),properties_fm(:,2),0.05,'right');%左边>右边
% [h3,p3,ci_3,stats_3]=ttest(properties_ff(:,3),properties_fm(:,3),0.05,'left');
% [h4,p4,ci_4,stats_4]=ttest(properties_ff(:,4),properties_fm(:,4),0.05,'left');
% h_p=[h1 h2 h3 h4;p1 p2 p3 p4];
% % save(['F:\kangkang_data\properties_result\','fn_f_properties.mat'],'h_p');


%% 负性:男性女性网络属性比较
% F_F={'_F_andro'};  %  ,'_F_non_andro_female'     _F_andro_female
% F_M={'_F_non_andro'};  %  ,'_F_non_andro_male'       _F_andro_male
% SaveFile = 'D:\56_properties\';
% File = dir(SaveFile);
% l1 = [];l2= [];
% for k =1:1
%     eval(['load',' ',SaveFile,'\properties',num2str(F_M{k}),'.mat']);
%     l1{k} = length(properties_1);ff1{k} = properties_1;
%     eval(['load',' ',SaveFile,'\properties',num2str(F_F{k}),'.mat']);
%     l2{k} = length(properties_1);fm1{k} = properties_1;
% end
% properties_ff(1:l1{1,1},:) = ff1{1};
% % properties_ff(l1{1,1}+1:l1{1,1}+l1{1,2},:) = ff1{2};
% % properties_ff(l1{1,1}+l1{1,2}+1:l1{1,1}+l1{1,2}+l1{1,3},:) = ff1{3};
%
% properties_fm(1:l2{1,1},:) = fm1{1};
% % properties_fm(l2{1,1}+1:l2{1,1}+l2{1,2},:) = fm1{2};
% % properties_fm(l2{1,1}+l2{1,2}+1:l2{1,1}+l2{1,2}+l2{1,3},:) = fm1{3};
%
% [h1,p1,ci_1,stats_1]=ttest2(properties_fm(:,1),properties_ff(:,1),0.05,'left');%
% [h2,p2,ci_2,stats_2]=ttest2(properties_fm(:,2),properties_ff(:,2),0.05,'right');%左边>右边
% [h3,p3,ci_3,stats_3]=ttest2(properties_fm(:,3),properties_ff(:,3),0.05,'left');
% [h4,p4,ci_4,stats_4]=ttest2(properties_fm(:,4),properties_ff(:,4),0.05,'left');
% h_p=[h1 h2 h3 h4;p1 p2 p3 p4];
% % save(['F:\kangkang_data\properties_result\','ff_fm_properties.mat'],'h_p');


% %% 负性:性别角色网络属性ttest比较
% CV_F={'_CV_FF','_CV_MF'};
% CV_M={'_CV_MM','_CV_FM'};
% % CV_A={'_CV_FA','_CV_MA'};
% SaveFile = 'G:\properties\';
% File = dir(SaveFile);
% l1 = [];l2= [];
% for k =1:2
%     eval(['load',' ',SaveFile,'\properties',num2str(CV_F{k}),'.mat']);
%     l1{k} = length(properties_1);ff1{k} = properties_1;
%     eval(['load',' ',SaveFile,'\properties',num2str(CV_M{k}),'.mat']);
%     l2{k} = length(properties_1);fm1{k} = properties_1;
% end
% properties_ff(1:l1{1,1},:) = ff1{1};
% properties_ff(l1{1,1}+1:l1{1,1}+l1{1,2},:) = ff1{2};
%
%
% properties_fm(1:l2{1,1},:) = fm1{1};
% properties_fm(l2{1,1}+1:l2{1,1}+l2{1,2},:) = fm1{2};
%
%
% [h1,p1,ci_1,stats_1]=ttest2(properties_ff(:,1),properties_fm(:,1),0.05,'left');%
% [h2,p2,ci_2,stats_2]=ttest2(properties_ff(:,2),properties_fm(:,2),0.05,'right');%左边>右边
% [h3,p3,ci_3,stats_3]=ttest2(properties_ff(:,3),properties_fm(:,3),0.05,'left');
% [h4,p4,ci_4,stats_4]=ttest2(properties_ff(:,4),properties_fm(:,4),0.05,'left');
% h_p=[h1 h2 h3 h4;p1 p2 p3 p4];
% save(['F:\kangkang_data\properties_result\','ff_fm_properties.mat'],'h_p');
%
%
%


% %anova 分析比较男性,女性,双性化差异
% %在做之前先运行mvgc_v1.0(1)工具包中的startup函数,进行几种校验(才能够用fdr校验)
% clear all
% close all
% clc
%
% S_f={'_S_FF','_S_MF'};
% S_m={'_S_FM','_S_MM'};
% S_a={'_S_FA','_S_MA'};
%
% SaveFile = 'G:\properties\';
% File = dir(SaveFile);
% l1 = [];l2= [];l3 =[];
% for k =1:2
%     eval(['load',' ',SaveFile,'\properties',num2str(S_f{k}),'.mat']);
%     l1{k} = length(properties_1);ff1{k} = properties_1;
%     eval(['load',' ',SaveFile,'\properties',num2str(S_m{k}),'.mat']);
%     l2{k} = length(properties_1);fm1{k} = properties_1;
%     eval(['load',' ',SaveFile,'\properties',num2str(S_a{k}),'.mat']);
%     l3{k} = length(properties_1);fa1{k} = properties_1;
% end
% properties_ff(1:l1{1,1},:) = ff1{1};
% properties_ff(l1{1,1}+1:l1{1,1}+l1{1,2},:) = ff1{2};
%
% properties_fm(1:l2{1,1},:) = fm1{1};
% properties_fm(l2{1,1}+1:l2{1,1}+l2{1,2},:) = fm1{2};
%
% properties_fa(1:l3{1,1},:) = fa1{1};
% properties_fa(l3{1,1}+1:l3{1,1}+l3{1,2},:) = fa1{2};
%
% l_ff = length(properties_ff);l_fm = length(properties_fm);l_fa = length(properties_fa);
% group(1:l_ff,1)=1;group(l_ff+1:l_ff+l_fm,1)=2;group(l_ff+l_fm+1:l_ff+l_fm+l_fa,1)=3;%group为类别
%
% data=cat(1,properties_ff,properties_fm,properties_fa);
% Savepath = 'F:\kangkang_data\properties_result\';
% mkdir(Savepath);
% for i=1:4
%     [p,table] = anova1(data(:,i),group,'displayopt'); %-- repeated anova test-----
%      saveas(1,[Savepath, 'anova_',num2str(i),'.m']);%不太清晰可以改成其他格式
%      saveas(2,[Savepath, 'picture_',num2str(i),'.m']);
%      p_anova(:,i) = p(1);
%      close all;
% end
注意:(1)这段代码中有很大一部分是注释掉的,其实代码中包含了两个功能:计算网络属性,并对网络属性进行统计分析。(2)在用这个代码之前,你需要在你的matlab路径中添加一个包 2015_01_25 BCT。(3)导入的数据为之前算出来的plv值。(4)算完后的网络属性值可以通过里面的代码算统计结果,如果是两个条件之间的比较就用t检验,如果是三个条件之间的比较就用方差分析。
5.计算幅值与网络属性之间的相关
如果你想为你的结果寻找更强的证据支持,那么在算完网络属性的统计之后,还可以计算幅值和网络属性的相关。用到的代码是 correlation_analysis.m
% % 相关分析
% load 'F:\余康\groups_data\S_amp\f_a_data.mat';
% load 'F:\余康\groups_data\S_plv\f_a_data.mat';
% % 画幅值与plv相关显著脑区的脑网络图
% for  m = 1:size(plv_data,1)
%     for n =1:size(plv_data,2)
%         plvMatrix1 = squeeze(plv_data(m,n,:));
%         [Rho,Pval] = corr(amp_data',plvMatrix1,'type','pearson'); %皮尔森相关
%         if Pval <0.05
%             P1(m,n) = 1;
%         else P1(m,n) = 0;
%         end
%         R(m,n) = Rho;P(m,n) = Pval;%数据太少可能为NAN?
%     end
% end
% %% 画相关矩阵
%  k1 = length(P1(:,:));
%     f_name1 = '表达抑制条件下女性双性化群体LPP幅值与plv相关的脑网络';   %标题
%     channel ={'AF3','Fz','F1','F3','FC1','F7','FCz','FC3','Cz','C1','C3','CP3','Pz','P3','P5','P7','PO3','PO7','Oz','O1','AF4','F2','F4','F8','FC2','FC4','C2','C4','CPz','CP4','P4','P6','P8','POz','PO4','PO8','O2'};%换成你需要的导联
%     [x,y,loc]=textread('eeg_loc.txt','%*d %f %f %s',-1);
%     a = 0;
%     for i = 1:length(channel)
%         for j = 1:length(loc)
%             if strcmp(channel{i},loc{j})
%                 a = a+1;
%                 num(a) = j;
%             end
%         end
%     end
%     x1 = x(num);
%     y1 = y(num);
%     Brain_Graphic(P1(:,:),k1,f_name1,channel,x1',-y1');
%     title(f_name1,'fontsize',12,'fontweight','bold');
%     fig_name = ['S_FA'];
%  SaveFile = 'F:\余康\plot\correlation\';
%   saveas(1,[SaveFile, fig_name,'.jpg']);
% %     saveas(gcf,'F:\余康\plot\correlation\testTask.eps');
%    close figure 1;
%%%%%%%%%%%%%%%%%%%%%%%%%%%%%%%%%%%%%%%%%%%%%%%%%%%%%%%%%%%%%%%%%%%%%%%%%%%%%%%%%%%%%%%%%%%%%%%%%%%%%%%%%%%%%%%%%%%%%%
% 以上代码为画幅值与plv相关的脑网络,下面是计算幅值与网络属性的相关,跑代码的时候两边要分开跑
%

%%%%%%%%%%%%%%%%%%%%%%%%%%%%%%%%%%%%%%%%%%%%%%%%%%%%%%%%%%%%%%%%%%%%%%%%%%%%%%%%%%%%%%%%%%%%%%%%%%%%%%%%%%%%%%%%%%%%%%
%% 画相关图,%trimAccuracy代替其他属性值

load 'D:\56_plv_amp\amp_data\F_amp.mat';
load 'D:\56_properties\properties_F_all.mat';
% ampLpp = amp_data ;
trimAccuracy = properties_1(:,4);
[Rho,Pval] = corr(ampLpp',trimAccuracy,'type','pearson');%相关性计算
plot(ampLpp',trimAccuracy,'bo','MarkerFaceColor','k','MarkerSize',10);
fig_name = ['观看中性条件下双性化男群体相关图 ','R = ',sprintf('%.3f',Rho),'  ', 'P = ',sprintf('%.3f',Pval)];
% fig_name = ['R=',num2str(Rho),'  ', 'P=',num2str(Pval)];
title(fig_name,'fontsize',12,'fontname','bold');
xlabel('LPP amplitude value'); % x轴注解
ylabel('Clustering coefficency'); % 改成相应的网络属性的标题
hold on
k = polyfit(ampLpp',trimAccuracy,1);
xx = [-2 12];
yy = k(1)*xx+k(2);
plot(xx,yy,'r-', 'LineWidth', 2);

% SaveFile = 'D:\56_波幅与网络属性相关图\property1\';
% f_name = ['N_MA'];
% saveas(1,[SaveFile, f_name,'.jpg']);
% close Figure 1

% plot(trimCluster,trimAccuracy,'ro','MarkerFaceColor','r','MarkerSize',10);
% hold on
% k = polyfit(trimCluster,trimAccuracy,1);
% xx = [0 1];
% yy = k(1)*xx+k(2);
% plot(xx,yy,'r-', 'LineWidth', 2);
注意:上面代码导入的数据有两种,一种是波幅数据(在计算plv的时候算过,这个时候可以派上用场了),一种是网络属性数据,在计算的时候需要把不同的条件和不同的网络属性分开运行。
其它
关于添加电极
在计算脑网络的的时候,需要常见的21个电极(当然你也可以添加一些对你的研究比较重要的电极点),可能你的一些被试缺少一些关键的电极点,但是又不方便删除被试,这个时候就需要把这些电极点添加到你的数据中去(注意:这个和插值坏导是有区别的,插值坏导是针对本身存在的电极而言的,而此处是针对电极点本身就不存在的情况而言的)。添加电极的代码如下(代码名称add_lead.m):
% 补全导联
% clear all;close all;clc;
File = 'F:\101_addelectricity\';
eval(['pop_loadset',' ',File,'sub_',num2str(100),'.mat']);
% eval(['pop_loadset',' ',File,'sub',num2str(100),'_erp','.set']); %加载rest数据
struct = ans;
Data = struct.data;
%在中间插一个空白行CP2
[bool,inx] = ismember ({'FC4','C2','CP4','C6'},{struct.chanlocs.labels}.');%inx是位置,bool是布尔值
data = Data(inx,:,:);mean_data = mean(data,1);i = inx(2);l =length(struct.chanlocs);
data1 = Data(i+1:l,:,:);struct.data(i+1,:,:) = mean_data;struct.data(i+2:l+1,:,:)=data1;
%改变数据data
%改变结构体struct

a = {struct.chanlocs(i+1:l)}.' ;
%结构体struct
struct.chanlocs(i+1).labels = 'C4'; % 这里改为你要添加的那个电极的名称
struct.chanlocs(i+1).type =[];
struct.chanlocs(i+1).theta =[];
struct.chanlocs(i+1).radius=[];
struct.chanlocs(i+1).X=[];
struct.chanlocs(i+1).Y=[];
struct.chanlocs(i+1).Z=[];
struct.chanlocs(i+1).sph_theta=[];
struct.chanlocs(i+1).sph_phi=[];
struct.chanlocs(i+1).sph_radius=[];
struct.chanlocs(i+1).urchan=[];
struct.chanlocs(i+1).ref=[];
struct.chanlocs(i+2:length(struct.chanlocs)+1) =a{1,1};

savepath = 'F:\101_addelectricity\';
save([savepath,'sub_',num2str(100)],'-struct','struct');
% save([savepath,'S_data\','Sdata_',num2str(sub)],'S_data');


%% 转换文件格式
%  clear all;close all;clc;
% for Sub = 1:9;
%     savepath = 'D:\transdot_post\';
%     File = 'D:\transdot\';
%     % eval(['pop_loadset',' ',File,'sub_',num2str(100),'.mat']);
%     eval(['pop_loadset',' ',File,'sub',num2str(Sub),'.set']); %加载rest数据
%     struct = ans;
%     save([savepath,'sub_',num2str(Sub)],'-struct','struct');
% end
注意:上述代码的ismenber后面的电极是你要添加的这个电极的周围几个电极(一般取上下左右几个电极,一定要确保这些电极点都存在,否则会报错)。